
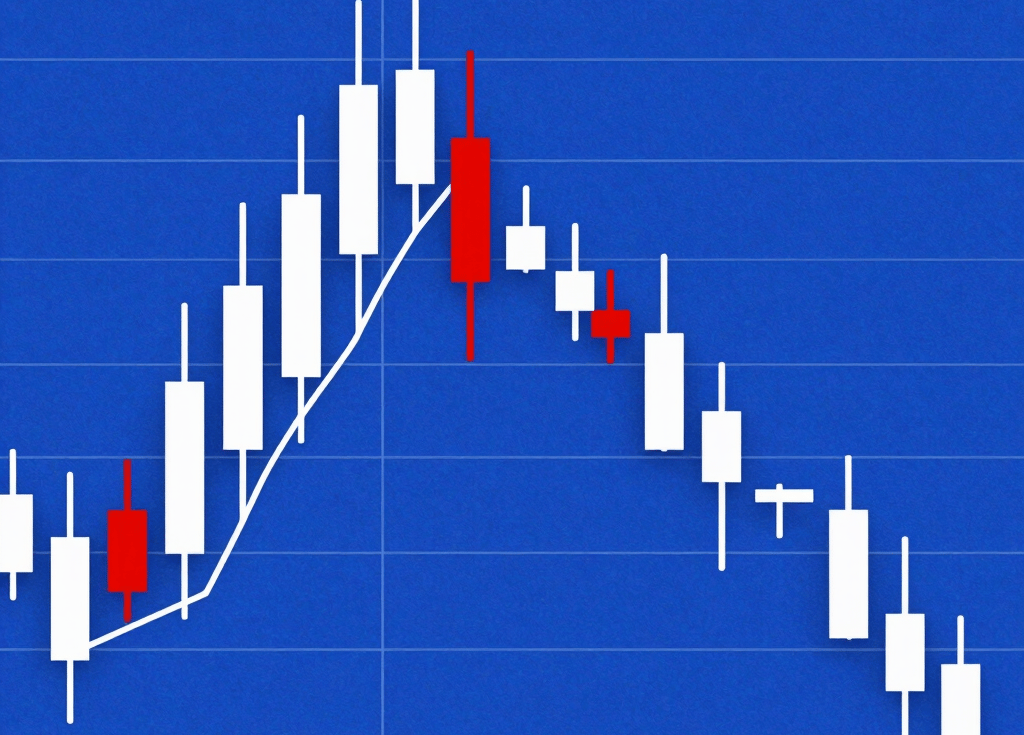
Candlestick Patterns
Visual guides to key trading candlestick formations
Candlestick Patterns Guide
Learn how candlestick charts reveal market sentiment and price action.


Why Patterns Matter
Recognizing patterns helps traders anticipate market moves and make smarter decisions.
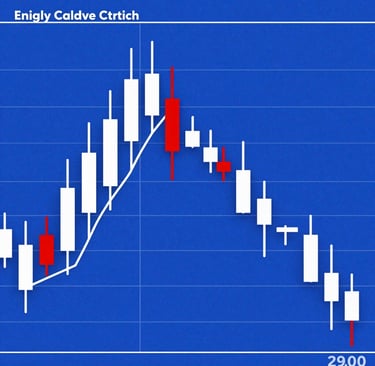
Patterns
A visual guide to key candlestick formations


FAQs
What are candlesticks?
Candlesticks are visual tools showing price movement in trading charts.
How to read patterns?
Look at the shape and color of candlesticks to interpret market sentiment.
Why use candlestick patterns?
They help traders predict potential price reversals or continuations with visual cues.
Are patterns always reliable?
No, patterns should be combined with other analysis tools for better accuracy.
Can beginners use them?
Yes, with practice, beginners can learn to spot and use these patterns effectively.
Contact us
sharemarketacademy@gmail.com
© 2025. All rights reserved.